Software engineering is a continuous dialogue of learning, and today, we're contributing our chapter: a detailed breakdown of networking incidents that unfolded in our Kubernetes environment on AWS during June. While the timing of these overnight occurrences fortunately minimized impact to our WHOOP members, they revealed critical insights into the subtle ways system updates can destabilize distributed infrastructure. What follows is our journey of investigation: how we tracked down the root cause, the challenges we uncovered, and the improvements we've implemented.
What We Observed
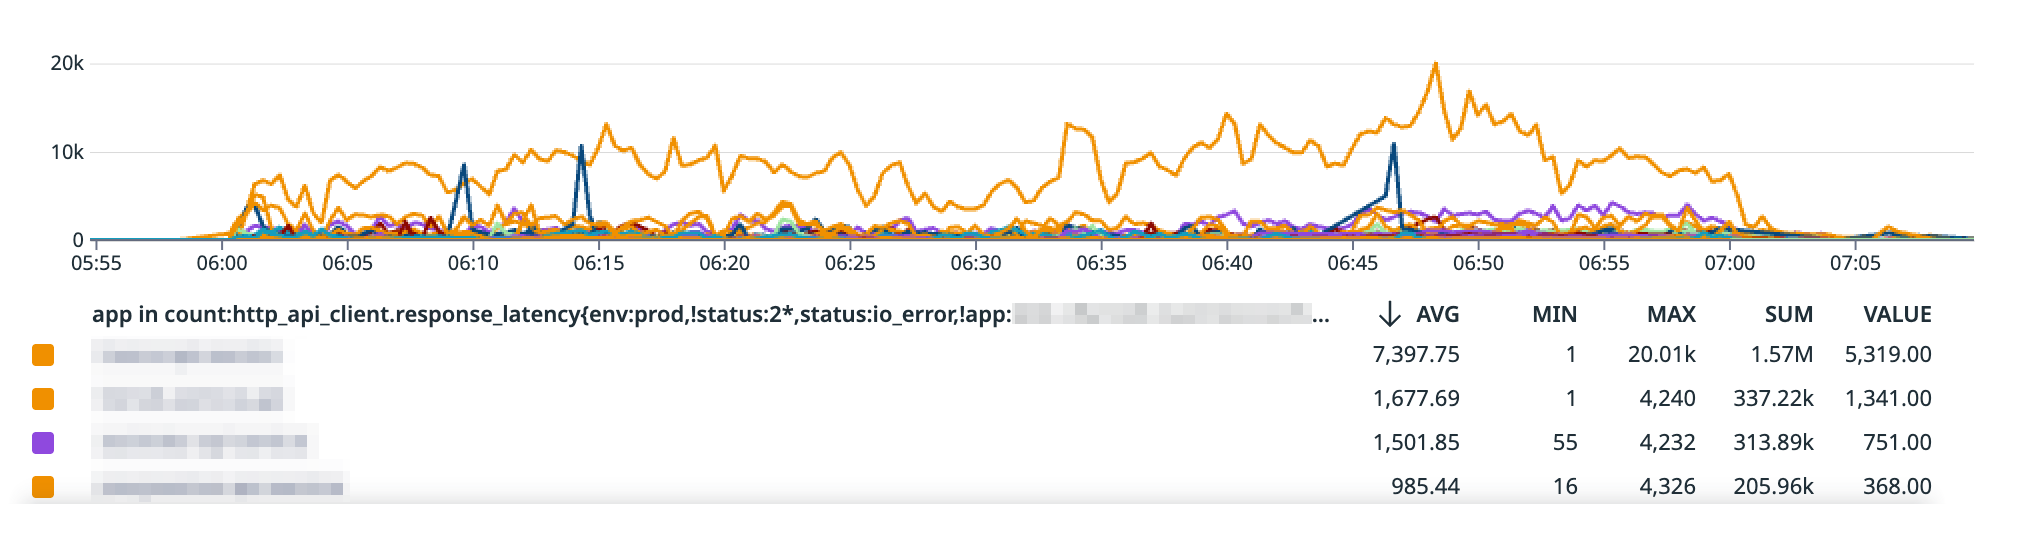
Between 2-3 AM ET on several nights, our monitoring revealed distinctive network performance anomalies captured in our detailed performance analysis graph.
The timing was fortunate, occurring during our lowest traffic periods, but the pattern was concerning enough to warrant a thorough investigation.
Key Diagnostic Symptoms
Latency Spikes:
- The performance graph reveals dramatic latency increases, with average response times jumping from ~1,000ms to over 7,000ms
- Peak latency reached as high as 20,000ms (20 seconds) for some API client requests (due mostly to application limits as TCP timeouts can take up to 2 hours by default)
Connection Characteristics:
- Intermittent TCP connection timeouts to external AWS services
- Consistent timing of incidents (2-3 AM ET)
- Minimal impact to application pod health
- Selective service disruption (primarily external service connections)
Metrics to Monitor: Engineers experiencing similar issues should look for:
- Sudden, sharp increases in HTTP API client response latency
- High variance in response times
- TCP connection reset or timeout errors
- Disproportionate failure rates for external service calls
Visualization Insights
The performance graph provides crucial insights:
- Each line represents API client response latency for a specific service
- Sharp vertical spikes indicate sudden, dramatic performance degradation
- Consistent baseline interrupted by unpredictable high-latency events
By tracking these specific metrics, teams can quickly identify and investigate similar networking disruptions in Kubernetes environments.
The Root Cause
The culprit turned out to be an interaction between Ubuntu's automatic security updates and a tool called needrestart. When certain system services restarted during these automated updates, they cleared the kernel's connection-tracking state — essentially erasing the node's "memory" of which pods owned which network connections.
Here's what happened: under normal conditions, when a pod establishes a connection to an external service, the node maintains state about that connection so it can properly route response packets back to the correct pod. When the networking services restarted, this tracking information was lost. Response packets from RDS and ElastiCache would arrive, but the node no longer knew which pod they belonged to, causing the traffic to be rejected and connections to timeout.
This behavior stemmed from a change in Ubuntu's update system that allowed automatic service restarts during unattended application of security patches. This feature that had previously been disabled by default due to related issues in Ubuntu's parent distribution.
Our Investigation Process
Initial triage: The symptoms initially appeared as generic network instability. We worked with AWS support while collecting VPC flow logs and packet captures, which revealed that traffic was being explicitly rejected during the incident windows.
Reproduction: The breakthrough came when we deliberately restarted the suspected system services on a test node and successfully reproduced the exact failure pattern. This confirmed our hypothesis about connection-tracking state loss.
Root cause analysis: We traced the service restarts back to the interaction between Ubuntu's unattended-upgrades and the needrestart utility, identifying the specific behavior change that enabled automatic restarts of critical networking services.
Validation tooling: We developed continuous packet capture capabilities to monitor node behavior and validate our fix, ensuring we could quickly identify any similar issues in the future.
How We Fixed It
Immediate response: We deployed a solution to prevent the problematic automatic service restarts on our Kubernetes nodes. Since implementing this change, the overnight connectivity issues have completely stopped.
Enhanced monitoring: We added targeted packet capture tools and expanded our observability to correlate application timeouts with network-level events, giving us better visibility into similar issues should they arise.
Infrastructure evolution: We're evaluating a transition from general-purpose Ubuntu to container-optimized operating systems like Flatcar. These platforms are designed specifically for cluster workloads and handle updates through coordinated, image-based approaches that drain nodes before applying changes rather than restarting services in place.
Rather than simply blocking updates indefinitely, we've implemented a more controlled update strategy that maintains security while preventing the disruptive service restarts that caused this issue.
Key Lessons
Small changes, big effects: A well-intentioned security feature had unintended consequences in our distributed environment. This reinforced the importance of understanding how system-level changes interact with containerized workloads.
Reproduction over speculation: Once we could reliably reproduce the failure, the investigation focused quickly on the actual cause rather than hypothetical explanations.
Purpose-built tools matter: General-purpose operating systems make assumptions about update behavior that don't always align with cluster-based infrastructure needs. Container-optimized platforms are designed with these constraints in mind.
Observability is key: Having the right monitoring and packet capture tools in place made the difference between a prolonged investigation and a focused resolution.
What This Means Going Forward
Reliability remains our top priority. While member impact was minimal due to timing, we take any repeated system interruption seriously. The immediate fix has eliminated these specific incidents, and our ongoing infrastructure improvements will help prevent similar classes of issues.
We're continuing to invest in tools and practices that make our platform more resilient, including better coordination between system updates and application workloads, enhanced monitoring capabilities, and infrastructure choices optimized for our distributed architecture.
This incident reinforced that even routine system maintenance can have unexpected effects in complex distributed systems, and that the best defense is a combination of careful tooling choices, robust monitoring, and the ability to quickly reproduce and understand system behavior when issues arise.